JEPI vs JEPQ: What $10,000 in Each Paid From 2022 to 2026
JEPI and JEPQ are two of the largest covered-call ETFs in the U.S. Both are run by J.P. Morgan, both charge 0.35% a year, both pay monthly, and each holds about $45 billion. Most comparisons stop at the current yield: about 8% for JEPI and nearly 12% for JEPQ, based on trailing 12-month distributions and late-October 2026 prices.
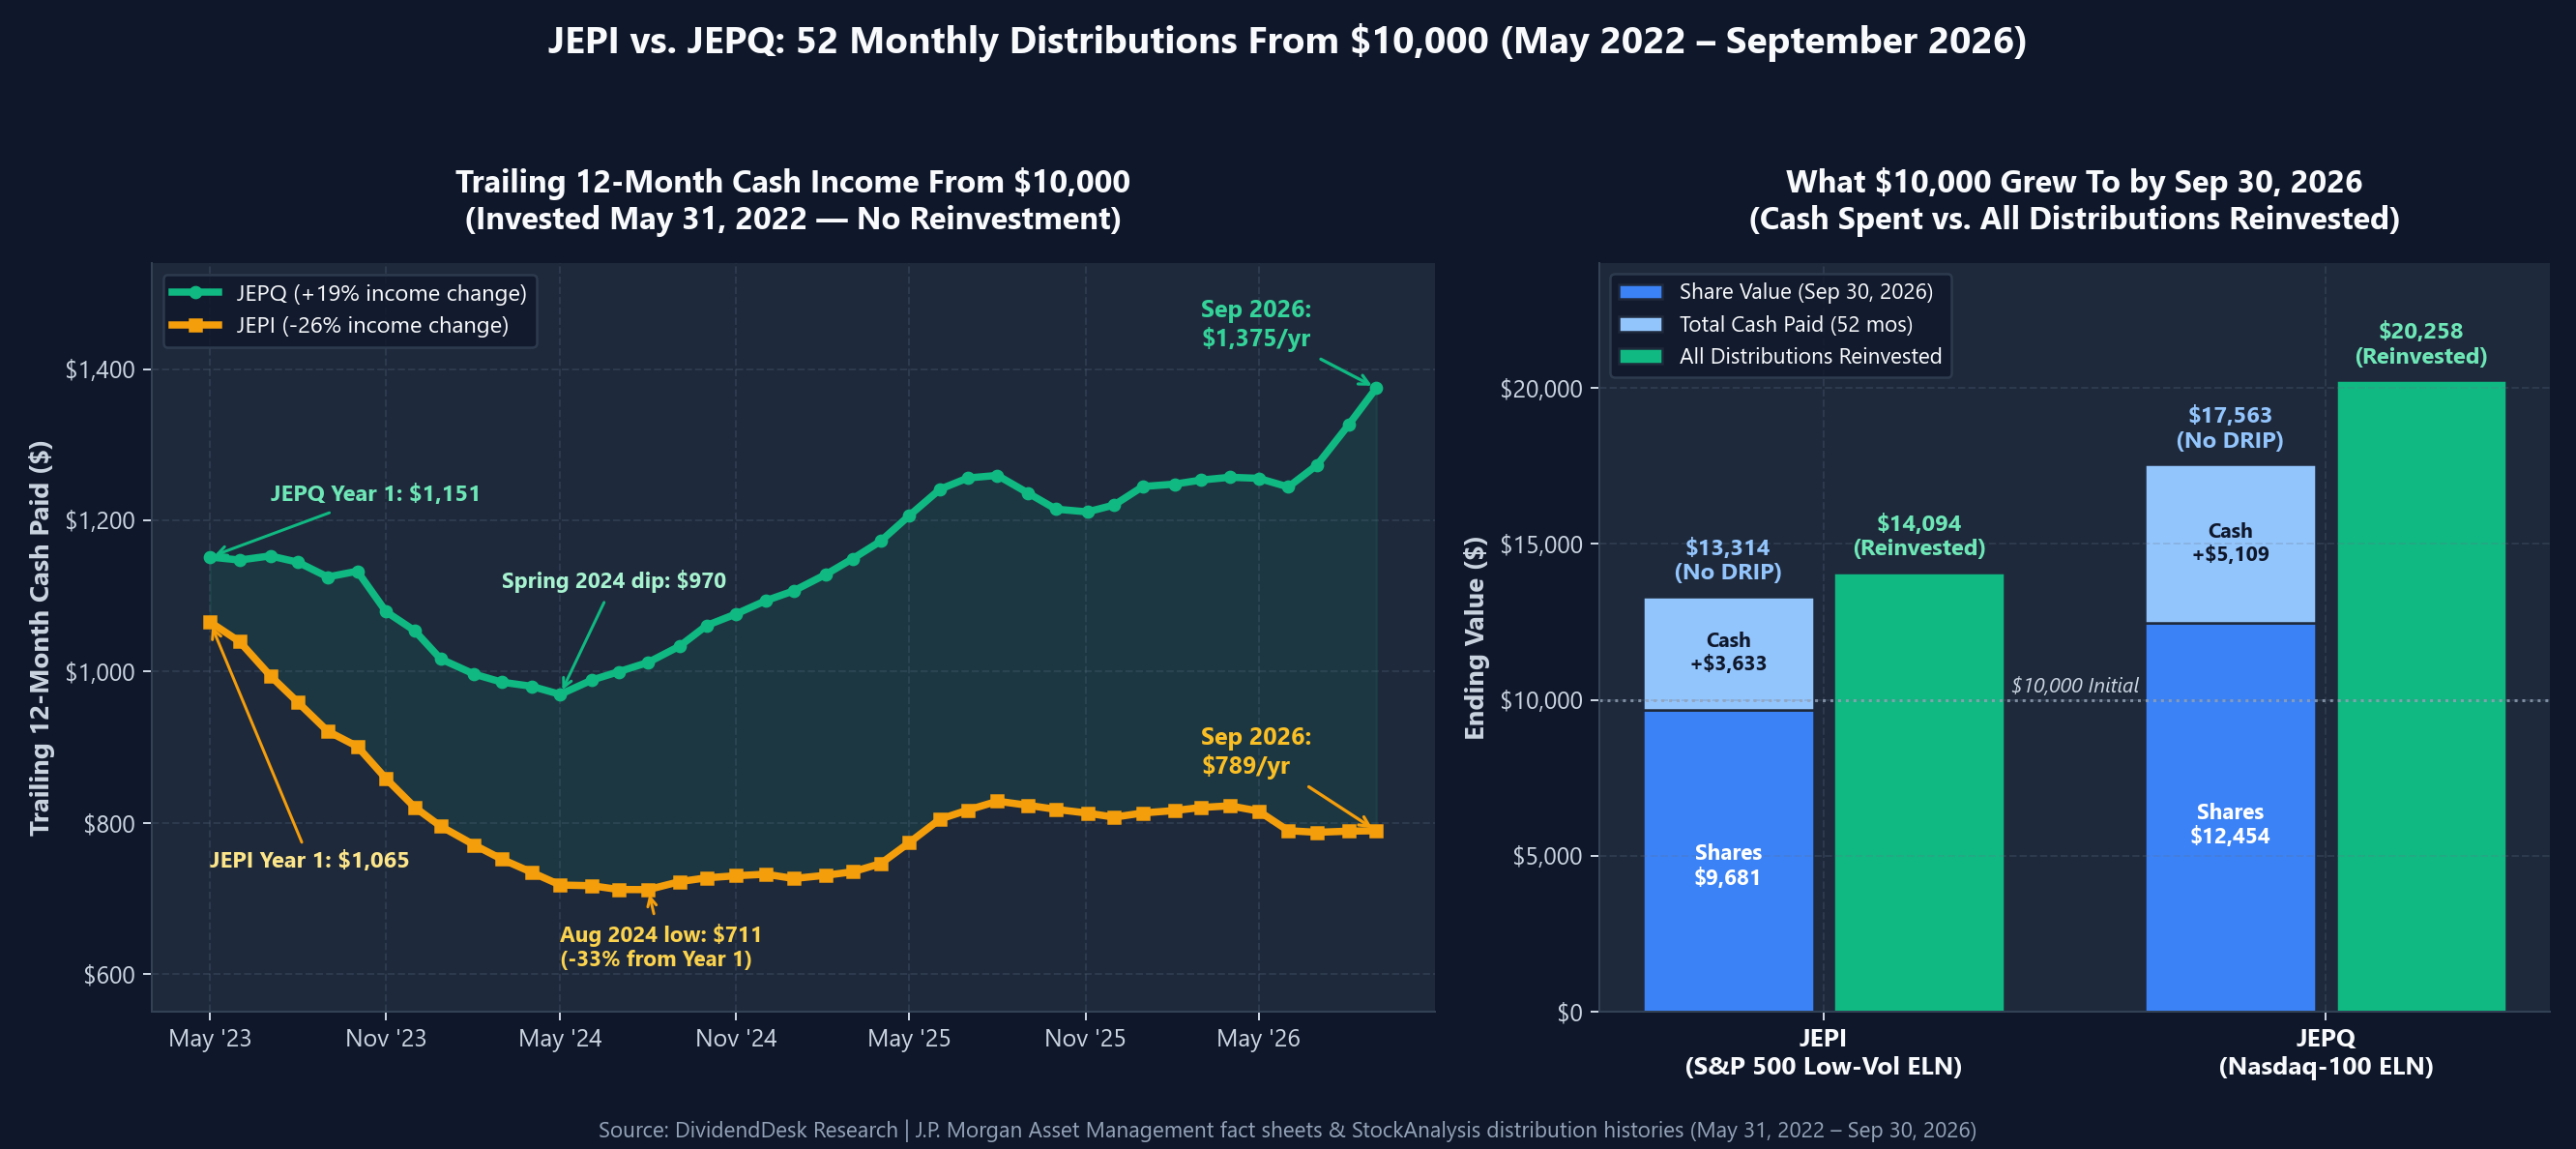
A yield is a snapshot, and both funds pay a different amount every month. So we asked what an investor actually received. We put a hypothetical $10,000 into each fund at the close on May 31, 2022, the first month-end after JEPQ launched, and followed every distribution through September 30, 2026: 52 monthly payments per fund.
The two funds started close together. They ended far apart, and the gap isn't only the yield.
The Results in One Table
$10,000 invested at the May 31, 2022 close, distributions with ex-dates from June 1, 2022 through September 1, 2026, values at the September 30, 2026 close. All figures are before taxes.
| JEPI | JEPQ | |
|---|---|---|
| Starting price (May 31, 2022) | $58.07 | $49.19 |
| Shares bought | 172.2 | 203.3 |
| Income, first 12 months | $1,065 | $1,151 |
| Income, latest 12 months | $789 | $1,375 |
| Change in annual income | −26% | +19% |
| Total cash paid over 52 months | $3,633 | $5,109 |
| Price on Sep 30, 2026 | $56.22 | $61.26 |
| Value of the shares | $9,681 | $12,454 |
| Shares + cash (not reinvested) | $13,314 | $17,563 |
| Value with all distributions reinvested | $14,094 | $20,258 |
JEPI vs. JEPQ: Custom Investment & Income Explorer
Based on all 52 monthly distributions from May 31, 2022 ($58.07 JEPI / $49.19 JEPQ) through September 30, 2026 ($56.22 JEPI / $61.26 JEPQ), pre-tax.
Three things stand out:
- JEPI's income shrank. The JEPI investor who spent the distributions collected $1,065 in the first year and $789 in the latest one. That's 26% less income, before any adjustment for inflation.
- JEPI's shares didn't grow. After 52 months, the $10,000 of JEPI shares was worth $9,681. Almost all of JEPI's return came out as cash.
- JEPQ did better on both counts. Its income rose 19%, and its shares gained 25% while paying out more than 11% a year.
Why JEPI's Income Fell
The shrinking payout wasn't a cut in the usual sense. Neither fund promises a fixed distribution. Each month they pay out mainly what they earned from selling call options, plus the dividends of the stocks they hold.
Both funds sell call options on a stock index: the S&P 500 for JEPI and the Nasdaq-100 for JEPQ. They do most of this through equity-linked notes (ELNs): notes issued by banks that combine exposure to the index with a sold call option. ELNs add counterparty risk, because they depend on the issuing bank. The price of an option rises with expected volatility. When markets are nervous, the funds collect more premium and pay out more. When markets are calm, they collect less.
That's why the starting point matters so much. Our investor bought in May 2022, in the middle of a bear market, when option premiums were unusually high. JEPI's distributions for the following 12 months totaled $6.19 a share, a 10.7% yield on the $58.07 purchase price. As markets calmed in 2023 and 2024, premiums fell, and so did the payout:
| Calendar year (by ex-date) | JEPI per share | JEPQ per share |
|---|---|---|
| 2023 | $4.62 | $5.00 |
| 2024 | $4.22 | $5.44 |
| 2025 | $4.72 | $6.12 |
| Oct 2025–Sep 2026 | $4.58 | $6.76 |
Each year has 12 payments. The distribution with an ex-date in late December is paid in early January.
JEPI's trailing income bottomed at $4.13 a share in August 2024, 33% below where it started. It recovered partway in 2025, when the April tariff sell-off briefly lifted volatility (JEPI's May and June 2025 payouts were its largest since 2022), and has stayed between about $4.55 and $4.80 a share since.
The lesson for buyers: a covered-call fund's yield is highest right after markets have been volatile, which is often when it looks most attractive. Our investor's first-year payout worked out to a 10.7% yield on cost, but later years paid far less. Anyone buying either fund today at its trailing yield should expect the payout to change, in either direction, as volatility changes.
Why JEPQ's Income Rose
JEPQ's payout per share fell in 2023 too, but much less, and then rose in 2024, in 2025, and again over the latest 12 months. Two forces did it.
Higher option premiums. The Nasdaq-100 is more volatile than the S&P 500, so options on it pay more. That's the main reason JEPQ yields more than JEPI.
A growing base. The payout is roughly a percentage of what the fund holds. When the fund's stocks rise, the same percentage produces more dollars. The Nasdaq-100 rallied strongly from 2023 to 2026, JEPQ's price rose with it, and so did its dollar distributions. JEPQ's August 2026 distribution of $0.705 a share was its largest ever.
JEPI holds a different kind of portfolio. Its 140 stocks are chosen for lower volatility, and its top 10 holdings each weigh about 2% of the fund. JEPQ holds 109 stocks that look much more like the Nasdaq-100: its top 10 holdings make up more than 43% of the fund, led by NVIDIA (7.4%), Apple (6.4%), and Microsoft (5.2%). JEPQ's shares grew because those stocks grew.
How Much of the Market's Gain Each Fund Kept
Covered calls trade upside for income. When the index rallies past the options' strike prices, the fund gives up those gains. To see how much each fund gave up, we used J.P. Morgan's published calendar-year total returns at net asset value (NAV) and compounded them from January 1, 2023 to September 30, 2026. This window starts seven months later than our $10,000 example, because J.P. Morgan publishes index returns by calendar year:
| Jan 2023–Sep 2026, total return | Fund | Its index | Share of the index's gain kept |
|---|---|---|---|
| JEPI vs. S&P 500 | +38.5% | +109.8% | 35% |
| JEPQ vs. Nasdaq-100 | +123.7% | +186.0% | 67% |
Neither fund kept up with its index in a strong bull market, which is expected. But the gap differs a lot. JEPI kept about a third of the S&P 500's gain. JEPQ kept about two-thirds of the Nasdaq-100's.
The likely reason is the stocks underneath. JEPI's lower-volatility stocks probably lagged the S&P 500 in a market led by a handful of large technology companies, on top of the upside the options gave away. JEPQ owns those technology companies.
What JEPI Does Better: Smaller Losses
The comparison above covers a rising market. JEPI was built for the other kind.
In 2022, the S&P 500 lost 18.1%. JEPI lost 3.5%, according to J.P. Morgan's figures. JEPQ launched in May 2022, so it has no full year in a bear market. From its launch through the end of 2022, it lost about 11% while the Nasdaq-100 lost about 16%. (We derived those two figures from J.P. Morgan's since-launch and calendar-year returns, so treat them as approximate.)
J.P. Morgan's three-year risk figures point the same way:
| As of Sep 30, 2026 | JEPI | S&P 500 | JEPQ | Nasdaq-100 |
|---|---|---|---|---|
| Standard deviation (3 years) | 7.78% | 12.42% | 11.26% | 17.24% |
| Beta (3 years) | 0.42 | — | 0.61 | — |
JEPI's returns swung only about two-thirds as much as JEPQ's. These figures cover a mostly rising market. In a year like 2022, that difference could matter more than the yield gap. Our 52-month window happened to favor technology stocks, and that helped JEPQ. A long bear market in technology stocks would test it in a way it hasn't yet faced.
Reinvesting Didn't Grow JEPI's Income
Many investors reinvest distributions while they're still working, expecting their income to snowball. We checked what that did for each fund.
| Distributions reinvested | JEPI | JEPQ |
|---|---|---|
| Income, first 12 months | about $1,120 | about $1,220 |
| Income, latest 12 months | about $1,100 | about $2,100 |
| Value on Sep 30, 2026 | $14,094 | $20,258 |
With JEPI, reinvesting every distribution for four years left annual income about where it started. The extra shares bought only made up for the lower payout per share. With JEPQ, reinvested income grew about 72%.
The reinvested values come from distribution-adjusted market prices, which assume each distribution is reinvested when paid. They track J.P. Morgan's published returns closely. For example, our JEPI figure for January to September 2026 matches J.P. Morgan's reported year-to-date NAV return of 3.65%. The reinvested income figures are approximate, because we estimated the shares held at each payment from month-end prices.
Taxes: The Same Problem for Both
Most of JEPI's and JEPQ's distributions have historically been taxed as ordinary income, not as qualified dividends. Option and ELN income doesn't qualify for the lower rates. In a taxable account, a high-bracket investor keeps much less of either fund's yield than the headline number suggests.
The tax drag is similar as a share of each payout. But JEPQ pays more cash, so its tax bill in dollars is larger, and its lead in a taxable account is smaller than the pre-tax numbers above show. A portion of each fund's distributions has usually been qualified dividends; the exact split is on each year's Form 1099-DIV. Taxes also matter for where you hold these funds. We ran the numbers by tax bracket in JEPI in a Roth IRA vs. a taxable account, and the same logic applies to JEPQ. See also our asset location analysis for how to rank income funds when deciding which account holds what, and our 12-year HDV vs. SCHD and VYM study for how qualified-dividend equity ETFs compare.
Which One Fits
The numbers don't make one fund better for everyone. They show that the two funds behave differently.
JEPI may fit if:
- You want the smaller drawdowns of the two. It lost far less than the S&P 500 in 2022.
- You're spending the income and can accept a payout that drops in calm markets.
- You already own plenty of large technology stocks elsewhere and don't want more.
JEPQ may fit if:
- You want more income now and can accept bigger price swings.
- You're comfortable with a portfolio concentrated in the Nasdaq-100's largest stocks. More than 43% sits in 10 companies.
- You understand that its 2023–2026 record came during a strong market for those stocks.
Either way:
- Judge either fund by trailing 12-month income over several years, not by one month's payout or its current yield.
- Expect the distribution to rise after volatile periods and fall in calm ones.
- Don't count on the payout covering a fixed expense. JEPI's income varied by about a third from its high to its low over this period.
If you're comparing high-yield funds generally, our QYLD analysis shows what happens when a covered-call fund's price erodes over time. Neither JEPI nor JEPQ has shown that pattern so far. JEPI's price was nearly flat over our window, and JEPQ's rose.
Methodology and Limitations
- Distributions: all 52 monthly distributions per fund with ex-dates from June 1, 2022 through September 1, 2026, from StockAnalysis. We cross-checked JEPQ against two other distribution histories, which agreed. For JEPI, we checked our distributions against J.P. Morgan's returns through the price data below. Trailing 12-month totals as of October 2026 ($4.56 for JEPI, $6.88 for JEPQ) match StockAnalysis.
- Prices: month-end closing prices. Our distribution-adjusted price returns match J.P. Morgan's published NAV calendar-year returns to within 0.1 percentage point (for example, JEPI 2023: 9.83% vs. 9.88%; JEPQ 2023: 36.29% vs. 36.28%).
- Index comparison: J.P. Morgan's fact sheets dated September 30, 2026, compounding the 2023, 2024, and 2025 calendar-year NAV returns with the 2026 year-to-date return.
- Purchase date: May 31, 2022, because JEPQ launched May 3, 2022 and paid its first distribution in June. A different start date would give different results. An investor who bought in a calm market would have started with a lower yield and seen less of a decline.
- Not included: taxes, inflation, trading costs, and bid-ask spreads. Both funds' 0.35% expense ratio is already reflected in their prices and distributions.
- Hypothetical: these results are hypothetical and don't represent any actual account.
The downloadable data lists every distribution and the income from $10,000 at each payment. It also includes each fund's October 2026 distribution, used only for the trailing 12-month check and marked as outside the window.
Data: jepi-vs-jepq-10000-since-2022.csv
Sources: J.P. Morgan Asset Management, JEPI and JEPQ fact sheets (September 30, 2026); StockAnalysis distribution histories; month-end price histories.
The Bottom Line
From May 2022 to September 2026, $10,000 in JEPQ paid $1,476 more in cash than $10,000 in JEPI, and its shares ended $2,772 higher. JEPQ's yearly income grew 19% while JEPI's fell 26%.
JEPI's income fell because option premiums eased from their 2022 highs. JEPQ pulled ahead because options on the more volatile Nasdaq-100 pay more, and because the technology stocks it holds rallied strongly. JEPI's real advantage is the one it showed in 2022, when it lost 3.5% while the S&P 500 lost 18%. Pick by the risk you can live with, and expect either fund's yield to keep changing.