REITs Are Sold as an Inflation Hedge. Their ETF Payouts Lost to Inflation.
REITs Are Sold as an Inflation Hedge. Their ETF Payouts Lost to Inflation.
The case for real estate income goes like this: when prices rise, rents rise; when rents rise, landlords earn more; and REITs pass much of that to shareholders. Real estate funds are often presented as an inflation hedge for income investors for exactly this reason.
We tested the claim the way an income investor experiences it. We took every distribution paid by three large real estate ETFs, added them up by calendar year, and compared them with the Consumer Price Index.
The payouts did not keep up. From 2014 to 2025 (2016 to 2025 for XLRE), all three funds' distributions bought less at the end than at the start. Over the same years, every stock dividend ETF in our previous analyses grew its payout faster than inflation.
What We Measured
| Fund | Name | What It Holds |
|---|---|---|
| VNQ | Vanguard Real Estate ETF | U.S. REITs and other real estate companies |
| IYR | iShares U.S. Real Estate ETF | U.S. real estate stocks, capped index |
| XLRE | Real Estate Select Sector SPDR | Real estate companies in the S&P 500 |
For each fund we summed every quarterly cash distribution per share by calendar year, grouped by ex-dividend date. VNQ and IYR cover 2014–2025. XLRE launched in October 2015, so its record starts in 2016, its first full year.
To measure purchasing power, we divided each year's payout by that year's average Consumer Price Index for All Urban Consumers (CPI-U) from the Bureau of Labor Statistics. A year of distributions is spent across a year of prices, so annual averages are the matching measure. The 2025 average covers eleven months, because the October 2025 index was never published. Consumer prices rose 36.0% from 2014 to 2025. You can download the data.
We also looked at Schwab's SCHH but left it out. Our data source doesn't adjust SCHH's earlier payments for its 2-for-1 share split in March 2022, and its records before late 2015 are incomplete.
The Result
| Fund | Period | Payout Change | Consumer Prices | Payout After Inflation | Per Year | Years the Payout Fell |
|---|---|---|---|---|---|---|
| VNQ | 2014–2025 | +18.9% | +36.0% | -12.5% | -1.21% | 4 of 11 |
| IYR | 2014–2025 | -17.2% | +36.0% | -39.1% | -4.41% | 5 of 11 |
| XLRE | 2016–2025 | +7.2% | +34.1% | -20.1% | -2.46% | 4 of 9 |
VNQ, the largest real estate ETF, raised its payout 18.9% over eleven years while prices rose 36.0%. IYR's payout didn't just fall behind inflation; it fell in plain dollars, from $2.81 per share in 2014 to $2.33 in 2025.
XLRE's figure needs a caveat: 2016 was an unusually high year for it, and its 2017 payout was 17.5% lower. Measured from any later start year, XLRE lost between 1.0% and 7.3% of its purchasing power. That's still a loss, but a smaller one.
Put in dollars: if one of these funds paid you $10,000 in its first year, the same shares paid this much in 2025, measured in first-year purchasing power:
| Fund | First-Year Income | 2025 Income, in First-Year Purchasing Power |
|---|---|---|
| VNQ (2014) | $10,000 | $8,746 |
| XLRE (2016) | $10,000 | $7,995 |
| IYR (2014) | $10,000 | $6,092 |
Did Your Real Estate ETF Income Keep Up With Prices?
Choose a fund, a starting year, and the income it paid you that year. The chart compares what the same shares actually paid with what you would have needed to keep pace with CPI-U.
VNQ paid less than the inflation-adjusted amount in 7 of 11 years after 2014. Calendar-year distributions by ex-dividend date; CPI-U annual averages (2025 uses eleven published months). Historical data only; not a forecast.
The Comparison With Stock Dividend ETFs
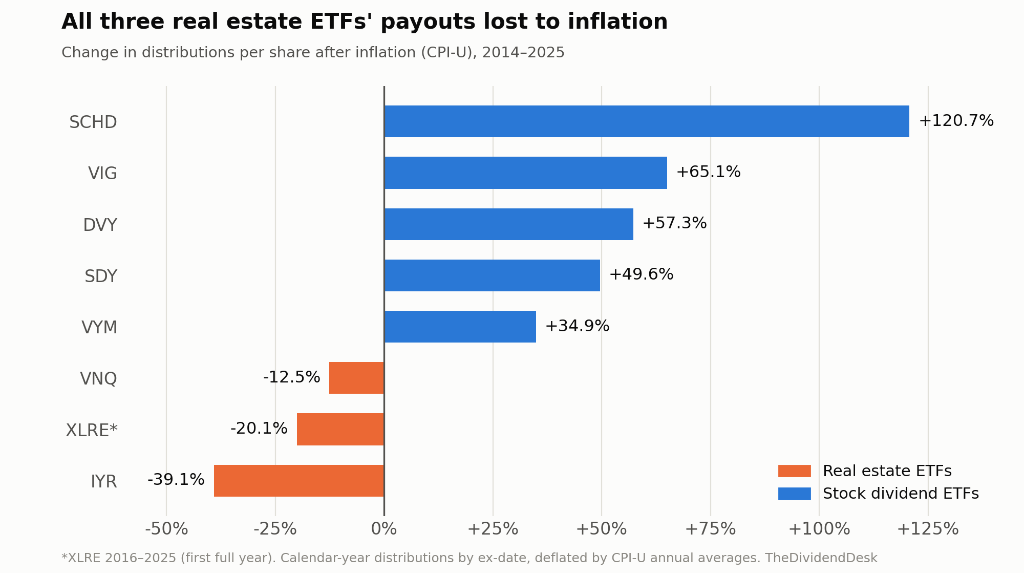
Over the same period, here is how the payouts of the stock dividend ETFs from our earlier research compared:
| Fund | Type | Payout After Inflation, 2014–2025 |
|---|---|---|
| SCHD | Stock dividend | +120.7% |
| VIG | Stock dividend | +65.1% |
| DVY | Stock dividend | +57.3% |
| SDY | Stock dividend | +49.6% |
| VYM | Stock dividend | +34.9% |
| VNQ | Real estate | -12.5% |
| XLRE | Real estate | -20.1% (2016–2025) |
| IYR | Real estate | -39.1% |
Measured from 2014, the weakest stock dividend fund, VYM, still beat inflation by 34.9%, while the strongest real estate fund lost 12.5%.
We repeated the comparison for every start year from 2014 to 2020. In six of the seven, the weakest stock fund beat the strongest real estate fund. The exception was 2020, a weak starting point for real estate payouts: from there, XLRE (-2.8%) did slightly better than SDY (-3.3%) and VYM (-3.2%).
One thing this comparison doesn't show is the level of income. It measures how each income stream grew, not how much each dollar invested produced. Real estate funds have often yielded more than funds like VIG, so a real estate fund can pay more total income than a low-yielding fund even while its payout loses purchasing power. For reference, here are recent trailing yields as reported by StockAnalysis in late September and early October 2026:
| Fund | Trailing Yield |
|---|---|
| VNQ | 3.76% |
| XLRE | 3.54% |
| DVY | 3.45% |
| SCHD | 3.17% |
| SDY | 2.53% |
| IYR | 2.43% |
| VYM | 2.33% |
| VIG | 1.51% |
Today, VNQ and XLRE yield slightly more than the highest-yielding stock fund here, DVY, while IYR yields less than DVY, SCHD, and SDY. These are current yields, not 2014 starting yields, so they don't settle the income-level question.
Is This Just the Start and End Years?
Real estate funds pay lumpy distributions. A large December payment can make one year look unusually high, so a single start or end year can distort the result. We checked three ways.
Averaging three years at each end. Comparing the average payout of each fund's first three years with the average for 2023–2025:
| Fund | After Inflation, Single Years | After Inflation, Three-Year Averages |
|---|---|---|
| VNQ | -12.5% | -21.2% |
| IYR | -39.1% | -40.0% |
| XLRE | -20.1% | -9.0% |
Changing the start year. Each fund measured from every start year through 2020, ending in 2025:
| Start Year | VNQ | IYR | XLRE |
|---|---|---|---|
| 2014 | -12.5% | -39.1% | — |
| 2015 | -18.2% | -41.7% | — |
| 2016 | -34.9% | -48.8% | -20.1% |
| 2017 | -24.8% | -41.2% | -1.0% |
| 2018 | +0.9% | -31.3% | -7.3% |
| 2019 | -6.2% | -34.8% | -6.6% |
| 2020 | -16.3% | -15.3% | -2.8% |
Changing the end year. From each fund's first year, ending in any year from 2018 to 2025, the payout lost purchasing power in 23 of 24 cases. The exception is VNQ ending in 2020 (+4.5%); in its other end years, VNQ lost between 6.8% and 13.4%.
These windows overlap, so they aren't independent tests. But in 18 of 19 start-year cases and 23 of 24 end-year cases, the payout lost ground to inflation. Both exceptions involve VNQ, and its history is worth a closer look.
What Happened to VNQ
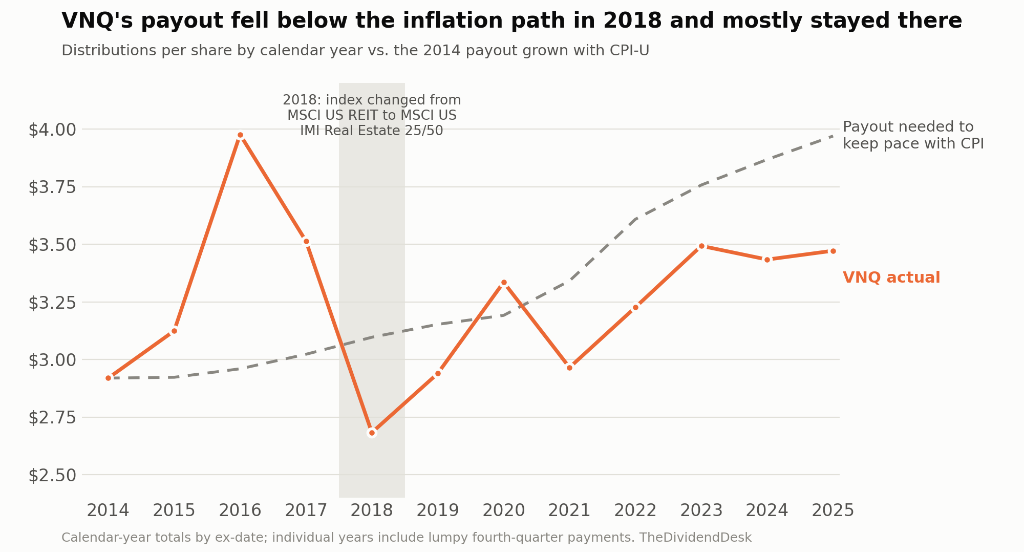
VNQ's payout was above its inflation-adjusted 2014 level in 2015, 2016, and 2017. Then it fell in two steps:
| Year | VNQ Payout | Change | Note |
|---|---|---|---|
| 2016 | $3.976 | +27.3% | Unusually large December payment ($1.695) |
| 2017 | $3.514 | -11.6% | Before any index change |
| 2018 | $2.683 | -23.7% | Year of VNQ's index change |
Part of the decline simply reversed the unusually high 2016. The rest landed in 2018, when, according to Vanguard, VNQ moved from the MSCI US REIT Index to a broader index that also includes real estate companies that aren't REITs (a transition index from February 2018, then the MSCI US Investable Market Real Estate 25/50 Index from July 2018).
The timing lines up, but it isn't the whole story. IYR also cut its payout 12.3% in 2018. So 2018 was a weak year for real estate fund payouts more broadly, and VNQ's index change may have added to it. Our data can't separate the two.
Since 2018, VNQ's payout has risen 29.4%, about the same as prices (+28.2%). But 2018 was its lowest year in the series, and that flatters the comparison. Measured from 2019, VNQ lost 6.2% after inflation, and from 2020 it lost 16.3%. Apart from 2020, its payout has stayed below the inflation-adjusted 2014 level in every year since 2018.
What About the 2021–2023 Inflation Surge?
The inflation-hedge argument is strongest during an actual burst of inflation. Comparing the average of 2018–2020, just before the surge, with the average of 2023–2025, after it, consumer prices rose 22.8%:
| Fund | Payout Change | After Inflation |
|---|---|---|
| XLRE | +17.4% | -4.4% |
| VNQ | +16.1% | -5.5% |
| IYR | -6.0% | -23.4% |
| VYM | +24.7% | +1.5% |
| SDY | +27.3% | +3.6% |
| DVY | +39.7% | +13.7% |
| VIG | +56.8% | +27.7% |
| SCHD | +69.2% | +37.7% |
VNQ and XLRE raised their payouts through the surge, but not by as much as prices rose. IYR's payout fell. Every stock dividend fund kept up, VYM only barely.
Did Total Return Make Up for It?
A shrinking real payout matters less if the fund's overall return was strong. Here are ten-year average annual total returns, with distributions reinvested, from each sponsor's fact sheet as of June 30, 2026:
| Fund | 10-Year Total Return (NAV) |
|---|---|
| XLRE | 6.31% |
| IYR | 5.23% |
| VNQ | 4.91% |
| Stock dividend ETFs (from our earlier analysis) | 9.37% to 13.13% |
Consumer prices rose about 3.3% a year over the same ten years. That leaves the real estate funds with positive real total returns of roughly 1.5% to 3% a year. That's positive, but well behind every stock dividend fund we track.
Why Might This Happen?
Our data shows that the payouts lagged, not why. Several explanations are plausible, and we didn't test them:
- Index changes. A change in methodology can shift a fund toward holdings that pay less, as may have happened to VNQ in 2018.
- A changing mix of property types. Real estate indexes now hold meaningful weights in newer property types. In IYR's portfolio as of June 30, 2026 (fund fact sheet), data center REITs made up 8.94% and telecom tower REITs 7.68%. When the mix shifts toward companies that pay out less per dollar of share price, the fund's payout can slow even while each company raises its dividend.
- Financing costs. REITs borrow heavily. When interest rates rose sharply in 2022–2023, higher interest expense absorbed some of the rent increases that would otherwise have reached shareholders.
- Rents aren't payouts. REITs must distribute at least 90% of their taxable income, but that rule is only a floor. Actual dividends are set by management based on cash flow after interest, maintenance, and other costs, so rising rents don't automatically mean rising dividends.
What This Means for Income Investors
Don't count on a real estate ETF's payout to keep up with inflation by itself. In this period, it didn't in any of the three funds we tested, measured from almost any start year, though XLRE from 2017 or 2020 came close.
Check the fund's history, not the asset class's reputation. "REITs hedge inflation" is an argument about properties and rents. What you actually receive is a fund's distribution, which also reflects index rules, sector weights, and the fund's own changes.
Consider the tax cost too. Most REIT distributions don't qualify for the lower qualified-dividend tax rate, though a 20% deduction available on most REIT dividends softens the difference. As our asset location analysis showed, that makes REIT funds a strong candidate for tax-advantaged accounts if you hold them at all.
Real estate can still play other roles, such as diversifying the sources of a portfolio's returns. But on the specific claim that its income protects against inflation, the last eleven years of ETF payouts don't support it.
What This Analysis Doesn't Capture
Fund payouts, not company dividends. We measured cash reaching ETF shareholders. Individual REITs' dividends, or a REIT-only index, could tell a different story.
What's in a distribution. REIT fund distributions can include return of capital and capital gains along with income. We measured total cash per share, not its tax character.
Growth, not level. As noted above, a fund with a falling real payout can still deliver more total income than a lower-yielding fund with a rising one. We didn't compare income per dollar invested.
One period. 2014–2025 included near-zero interest rates, a pandemic that hit some property types hard, and the fastest rate increases since the early 1980s. A different period could produce different results.
Three funds. SCHH was excluded for data reasons; other real estate funds may differ.
Lumpy annual totals. Large fourth-quarter payments make individual years noisy, which is why we tested three-year averages, every start year, and several end years.
Calendar-year grouping by ex-dividend date, CPI-U annual averages (2025 based on eleven months), and no taxes or fees beyond expense ratios.
The Bottom Line
From 2014 to 2025, consumer prices rose 36.0%. VNQ's payout rose 18.9% and IYR's fell 17.2%. After inflation, VNQ lost 12.5% of its purchasing power and IYR lost 39.1%. XLRE, from 2016, lost 20.1%, or 1.0% to 7.3% from any later start year. The losses held with three-year averages, in 18 of 19 start-year cases, and in 23 of 24 end-year cases. Over the same years, every stock dividend ETF we track gained purchasing power.
VNQ's payout fell in two steps, reversing an unusually high 2016 and then dropping again in 2018, the year its index changed and IYR's payout also fell. It hasn't returned to its inflation-adjusted 2014 level since, except in 2020. For income that keeps up with inflation, the record says the asset class's reputation was not enough.
Sources: Distribution history from dividendhistory.org, cross-checked against StockAnalysis for VNQ and IYR 2021–2025. CPI-U from the Bureau of Labor Statistics via FRED and the Federal Reserve Bank of Minneapolis. Fund details from Vanguard, iShares, and State Street fact sheets. Data: reit-etf-distributions-cpi-2014-2025.csv.