HDV Paid the Most for Five Years. Then SCHD Passed It: A 12-Year Record
The iShares Core High Dividend ETF (HDV) is one of the most popular high-yield dividend funds. It charges 0.08% a year and holds about 80 stocks chosen for their yield and financial health. Its two big 2026 changes — a 5-for-1 split in April and a switch from quarterly to monthly payments — made its per-share figures look very different. The split cut each share's dividend to a fifth, and monthly payments spread the same income across more checks.
None of that changes what HDV has paid. To see that, we went back 12 years. We put a hypothetical $10,000 into HDV at the close on December 31, 2013, and did the same with two popular alternatives: the Schwab U.S. Dividend Equity ETF (SCHD) and the Vanguard High Dividend Yield ETF (VYM). Then we added up every distribution through 2025.
HDV started out paying the most. That lead lasted five years.
The Results in One Table
$10,000 invested at the December 31, 2013 close, distributions by ex-dividend date from 2014 through 2025, values at the December 31, 2025 close. All figures are before taxes and adjusted for HDV's 2026 split and SCHD's 2024 split.
| HDV | VYM | SCHD | |
|---|---|---|---|
| Dividends received in 2014 | $349 | $306 | $286 |
| Dividends received in 2025 | $557 | $562 | $857 |
| Payout growth per year, 2014–2025 | 4.3% | 5.7% | 10.5% |
| Years the payout fell | 3 | 0 | 0 |
| Total dividends received, 2014–2025 | $5,693 | $5,437 | $6,433 |
| Value of the shares, end of 2025 | $17,311 | $23,030 | $22,447 |
| Shares + dividends (not reinvested) | $23,004 | $28,466 | $28,880 |
| Value with dividends reinvested | $26,712 | $33,291 | $33,172 |
| Total return per year (reinvested) | 8.5% | 10.5% | 10.5% |
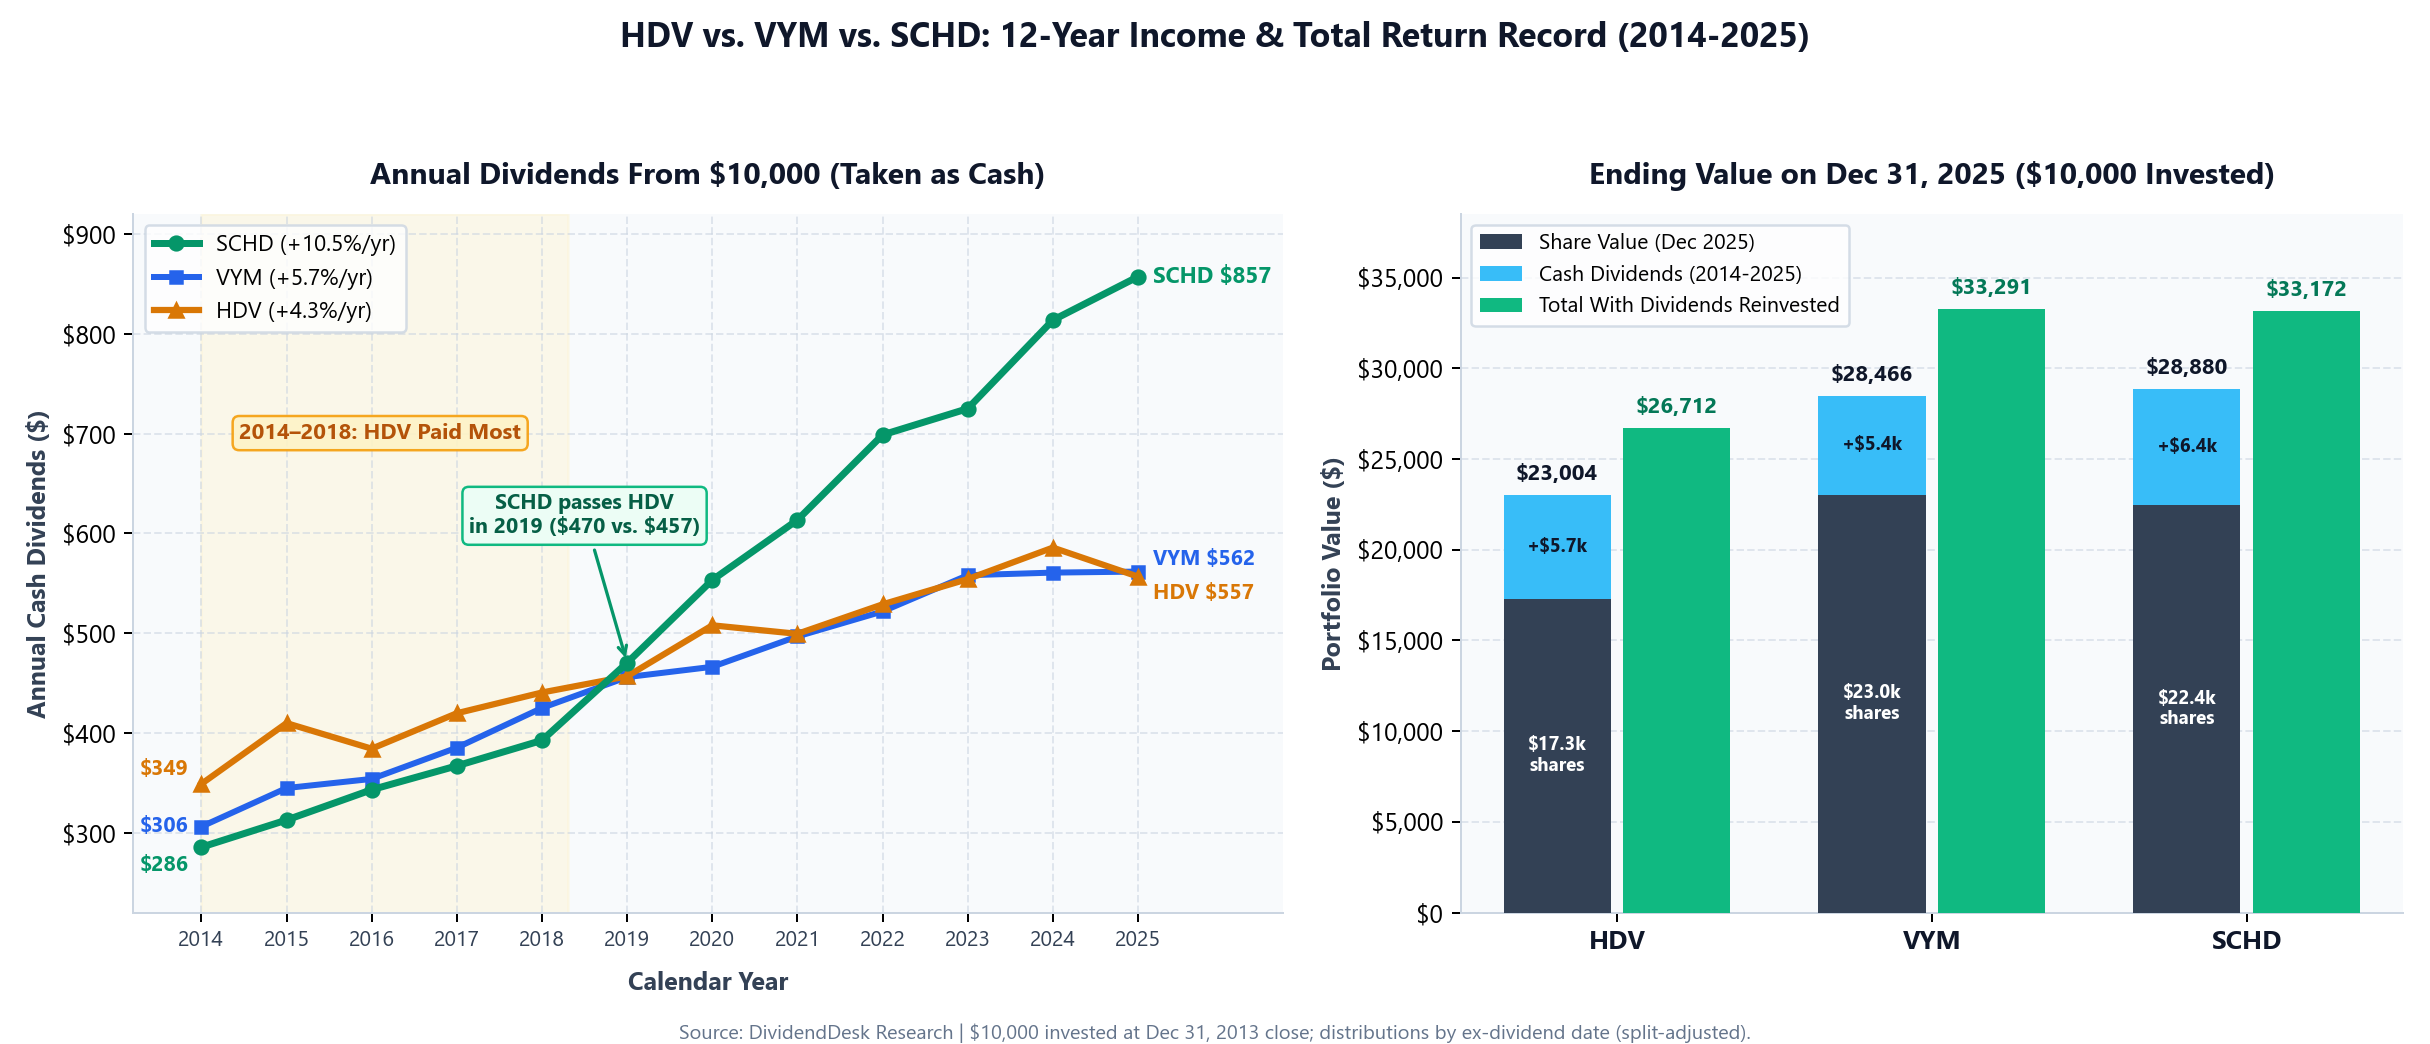
What the numbers show:
- HDV led on income for five years. From 2014 through 2018, $10,000 in HDV paid more each year than the same amount in either other fund.
- SCHD passed it in 2019 and kept going. By 2025, the SCHD investor received $857 a year, 54% more than the HDV investor's $557.
- VYM caught up from below. VYM started with 12% less income than HDV and finished essentially tied with it.
- HDV's shares grew the least. The HDV shares rose 73% in value, while VYM's and SCHD's more than doubled. That gap, more than the dividends, is why HDV's total return trailed by about 2 percentage points a year.
HDV vs. VYM vs. SCHD Income & Total Return Simulator
Scale the initial December 31, 2013 investment and scrub through any year from 2014 to 2025 to see when SCHD overtook HDV on annual and cumulative dividends.
HDV's Payout Grew Slowly, and Not Every Year
Here is each fund's payout change by calendar year:
| Year | HDV | VYM | SCHD |
|---|---|---|---|
| 2015 | +17.5% | +12.6% | +9.5% |
| 2016 | −6.3% | +2.7% | +9.7% |
| 2017 | +9.2% | +8.8% | +7.0% |
| 2018 | +5.0% | +10.3% | +7.0% |
| 2019 | +3.7% | +7.3% | +19.8% |
| 2020 | +11.2% | +2.3% | +17.6% |
| 2021 | −1.7% | +6.5% | +10.9% |
| 2022 | +5.9% | +5.0% | +13.9% |
| 2023 | +4.8% | +7.0% | +3.8% |
| 2024 | +5.7% | +0.5% | +12.2% |
| 2025 | −5.0% | +0.2% | +5.4% |
Over 11 years of changes, HDV's payout rose 60%. Consumer prices rose 36% over the same period, so HDV's income grew about 17% after inflation, or roughly 1.5% a year. VYM's grew about 35% after inflation, and SCHD's more than doubled (+121%).
Three things stand out in HDV's record:
- It's lumpy. HDV had the largest payout gain of the three funds in 2015 and 2017, but cut its payout in 2016, 2021, and 2025. Neither of the other funds had a down year.
- Its income held up in 2020. In the year of the pandemic, when many companies cut dividends, HDV raised its payout 11%, even as its share price fell. That's likely because its biggest payers, large energy, health care, and telecom companies, kept paying.
- Its recent growth stalled. HDV paid less per share in 2025 than in 2024. VYM's payout was also nearly flat in 2024 and 2025, so slow growth wasn't unique to HDV in those years.
Why HDV's Payout Grows Slowly: The Index Rules
HDV tracks the Morningstar Dividend Yield Focus Index. The index rules likely help explain the record above:
- Quality screens first. Stocks must pay qualified dividends, and REITs are excluded. Companies must also rank well within their sector on Morningstar's financial-health measure, "distance to default." Companies with a Morningstar competitive-advantage ("economic moat") rating and acceptable uncertainty face a looser cutoff than companies without one.
- Then the highest yields. Of the stocks that pass, the index takes the 75 with the highest indicated dividend yield.
- Weighted by dividend dollars. Each stock's weight depends on how many dollars of dividends it pays, not on its market value. The biggest dividend payers get the biggest weights. Caps keep any one stock at 10% or less, and stocks above 5% together at no more than 50%.
- Rebuilt every quarter. The index is reconstituted in March, June, September, and December. A current holding stays if it still ranks in the top 100 by yield.
Picking by current yield has a side effect. A stock's yield falls when its price rises faster than its dividend. A company whose earnings and dividend grow quickly often sees its price rise even faster, so its yield drops and it can fall out of the index. The stocks that stay have high yields today, which often means slow growth.
HDV's portfolio turnover was 65% in its most recent fiscal year, according to its August 2026 prospectus. That's high for a passive fund. Quarterly reconstitution by yield, and quarterly re-weighting by dividend dollars, likely both contribute.
SCHD takes a different approach. Its index, the Dow Jones U.S. Dividend 100, requires at least 10 years of consecutive dividends, limits itself to the higher-yielding half of eligible stocks, and then ranks them on a mix of cash flow to debt, return on equity, dividend yield, and five-year dividend growth. It weights holdings by market value, with caps. Ranking partly on dividend growth, not just current yield, is one plausible reason SCHD's payout grew more than twice as fast.
Dividend-Dollar Weighting Concentrates the Fund
Because weights follow dividend dollars, HDV leans heavily on a few large payers. As of July 31, 2026, its top four holdings were:
| Holding | Weight |
|---|---|
| Exxon Mobil | 7.9% |
| AbbVie | 6.2% |
| Chevron | 6.1% |
| Verizon | 5.5% |
Those four made up about a quarter of the fund, and two are oil companies. The exact holdings change often (remember the 65% turnover), but HDV has consistently leaned toward energy, health care, and telecom. That tilt shows up in its returns:
- When energy led, HDV did best. It returned +7.1% in 2022, when VYM was roughly flat and SCHD lost about 3%.
- When energy crashed, HDV did worst. It lost 6.5% in 2020, when SCHD gained 15%.
- It wasn't simply "anti-tech." In 2024 and 2025, both years led by technology stocks, HDV beat SCHD, though it trailed VYM.
Here are the calendar-year total returns, with distributions reinvested:
| Year | HDV | VYM | SCHD |
|---|---|---|---|
| 2014 | 12.6% | 13.6% | 11.8% |
| 2015 | −0.3% | +0.3% | −0.3% |
| 2016 | 15.8% | 17.0% | 16.5% |
| 2017 | 13.4% | 16.4% | 20.8% |
| 2018 | −2.9% | −5.9% | −5.5% |
| 2019 | 20.4% | 24.1% | 27.3% |
| 2020 | −6.5% | +1.2% | +15.0% |
| 2021 | 19.4% | 26.2% | 29.9% |
| 2022 | +7.1% | −0.5% | −3.3% |
| 2023 | 1.8% | 6.6% | 4.6% |
| 2024 | 14.2% | 17.6% | 11.7% |
| 2025 | 11.9% | 15.4% | 4.3% |
HDV figures for 2016–2025 are NAV returns from its prospectus. HDV's 2014–2015 figures and all VYM and SCHD figures are market-price returns from our distribution-adjusted price data.
From 2016 to 2025, HDV had the best year of the three in 2018 and 2022, and the worst in six of the ten years. It held up better than the other two in the 2018 and 2022 declines (and in our 5-ETF correlation matrix, HDV had the lowest correlation with SCHD and DGRO of any fund tested). It didn't help in 2020, when the decline hit energy stocks hardest.
HDV's Dividends Are Tax-Efficient
Because the index requires qualified dividends, HDV's distributions are generally taxed at the lower qualified-dividend rates. Its prospectus reports a 10-year return of 9.07% a year before taxes and 8.13% after taxes on distributions at the highest federal rate (see how all 11 major funds rank in our after-tax dividend ETF scorecard). SCHD and VYM also pay mostly qualified dividends, so this isn't an edge over them. It is an edge over high-income funds that pay mostly ordinary income. Covered-call funds, for example, pay mostly ordinary income, as we showed in our JEPI vs. JEPQ analysis. For a retiree with low taxable income, qualified dividends may be taxed at 0%, a strategy we explained in our 0% dividend tax bracket guide.
Who HDV Fits
HDV may fit if:
- You want high current income at a low cost and plan to spend it, not grow it.
- You want a fund that held up better than VYM and SCHD in 2018 and 2022, and you can accept that it fell in 2020.
- You want exposure to energy, health care, and telecom companies as a counterweight to a technology-heavy portfolio.
HDV may not fit if:
- You're relying on your dividends to keep up with inflation over decades. HDV's payout grew only about 1.5% a year above inflation from 2014 to 2025.
- You need income that never falls. HDV's payout dropped in three of 11 years.
- You want the best long-term total return. HDV trailed VYM and SCHD by about 2 percentage points a year.
Comparing it with alternatives:
- SCHD started with less income but grew it fastest. Over this period, its payout growth was worth more than HDV's higher starting yield. SCHD's total dividends received passed HDV's in 2022.
- VYM holds hundreds of stocks and is more diversified. Its income started lower than HDV's and ended about the same, with no down years and higher total returns. HDV still paid more than VYM in 10 of the 12 years, and more in total ($5,693 vs. $5,437).
- Combining funds can smooth income when different funds' weak payout years fall at different times, though HDV and VYM were both weak in 2025.
About HDV's 2026 Changes
Two 2026 changes affect how HDV's distributions look:
- The split: HDV split 5-for-1 effective April 29, 2026. Every per-share figure in this article is adjusted for the split, so pre-2026 amounts are a fifth of what was originally paid per share.
- Monthly payments: HDV moved from quarterly to monthly distributions in mid-2026. Monthly amounts vary a lot because the stocks it holds pay on different schedules. The trailing 12-month total, $0.958 a share as of October 2026, is a better guide than any single month. But it's 23% above HDV's 2025 total, and it spans the switch: the December 2025 quarterly payment plus the first monthly payments may cover more than 12 months of accrued dividends. One year that includes the transition isn't a trend, so a cleaner read comes once a full year of monthly payments is complete.
Methodology and Limitations
- Distributions: every HDV distribution by ex-dividend date from 2011 to 2026, from StockAnalysis and Digrin. The two sources agree, and our trailing 12-month total matches published figures. SCHD and VYM distributions are the same data used in our earlier 12-year distribution study. HDV had four distributions in every calendar year from 2012 through 2025.
- Prices: December month-end closing prices, adjusted for splits. For reinvested values and calendar-year returns, we used distribution-adjusted prices. For HDV, these matched iShares' published calendar-year returns to within about 0.1 percentage point in every year from 2016 to 2025.
- Inflation: CPI-U annual averages from the Bureau of Labor Statistics (2025 based on eleven published months).
- Not included: taxes and trading costs. Expense ratios are already reflected in each fund's prices and distributions.
- Starting point: a different start date would change the results. HDV's relative performance depends heavily on when energy stocks are strong.
- Hypothetical: these results are hypothetical and don't represent any actual account.
Data: hdv-vs-schd-vym-10000-2014-2025.csv
Sources: iShares Core High Dividend ETF summary prospectus (August 31, 2026); Morningstar Dividend Yield Focus Index rulebook; StockAnalysis HDV distributions; Digrin HDV history; BOX Options Exchange notice of the HDV 5-for-1 split; 24/7 Wall St. (holdings as of July 31, 2026); Bureau of Labor Statistics CPI-U.
The Bottom Line
From 2014 to 2025, HDV delivered what its name promises at the start: the highest income per dollar invested. But a fund that picks stocks by today's yield tends to own slow growers. HDV's payout grew 4.3% a year, fell in three years, and was passed by SCHD in 2019. Its shares grew far less than the other two funds' shares, so its total return trailed by about 2 points a year.
HDV makes sense as a low-cost, tax-efficient source of current income with a defensive tilt toward energy and health care. It makes less sense as the core of a portfolio meant to grow its income for decades.